The latest version of Calva comes with a debugger! It utilizes cider-nrepl and VS Code’s debugger extension API. This work has been done as part of the Clojurists Together Q1 2020 funding period. Many thanks to them for allowing us the time to focus on adding this feature, and many thanks to the cider-nrepl creators and maintainers for providing great foundational functionality for Clojure tooling.
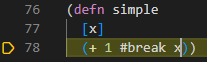
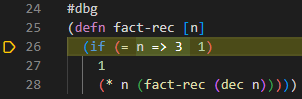
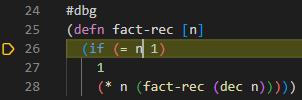
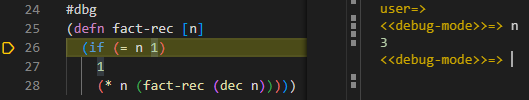
The debugger is still in an early stage, and more features are soon to come, but currently it supports adding breakpoints with #break and #dbg reader tags, pausing execution on those breakpoints, continuing execution, and evaluating code in the debug context (while execution is paused).
This looks very cool, but how do you get started with it? When I try F5/“Start Debugging” I’m offered a number of options which don’t seem to apply. Can you sketch what needs to be configured for a tools-deps debugger run, just to give us a starting point?
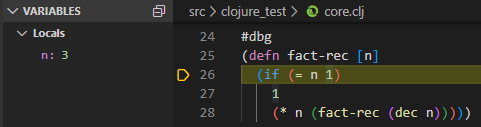
Great question. This isn’t what I suppose is the typical debugger experience for VS Code. It’s not started by using F5. When you evaluate a function with a #break in it, or #dbg before it (which basically sets invisible #breaks where appropriate in the function), then evaluate a call to that function, the debugger will start and execution will break on your breakpoint.
The docs linked in my comment above explain this procedure, but your question makes me realize this atypical debugger experience should be discussed more in the docs to avoid the confusion. Perhaps a video explaining the debugger would be good too. I’ll be working on improving the docs in the coming weeks, as I get more good feedback like yours. Thanks!