(in collaboration with @zcaudate)
Very often, data visualization with Apache Echarts can be done with nothing more than a JSON data structure.
This can be conveniently created from plain Clojure data structures, and is supported by the Kindly standard. See, for example, the (link might change) Data Visualizations with Echarts tutorial at the Noj book.
However, sometimes, a little bit of Javascript is necessary to define custom functions to be used in Echarts. For example, a function to determine the symbol size in a scatterplot.
One way to achieve that in Clojure is by transpiling Clojure forms into Javascript. This can be done using std.lang, a universal transpiler from Clojure to many languages.
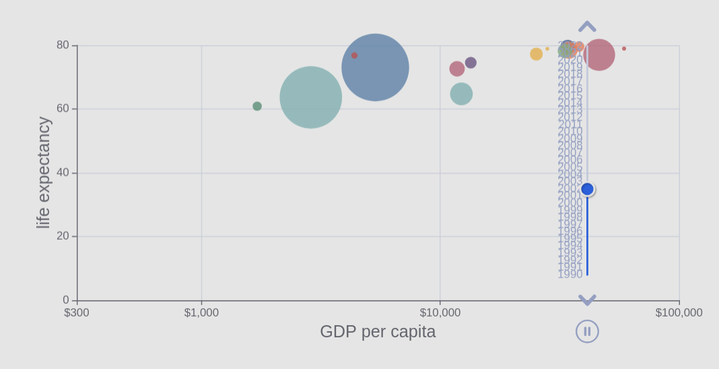
This tutorial will demonstrate that by mimicking Echarts’ life expectancy timeline example inspired by the famous Gapminder demo by Hans Rosling.