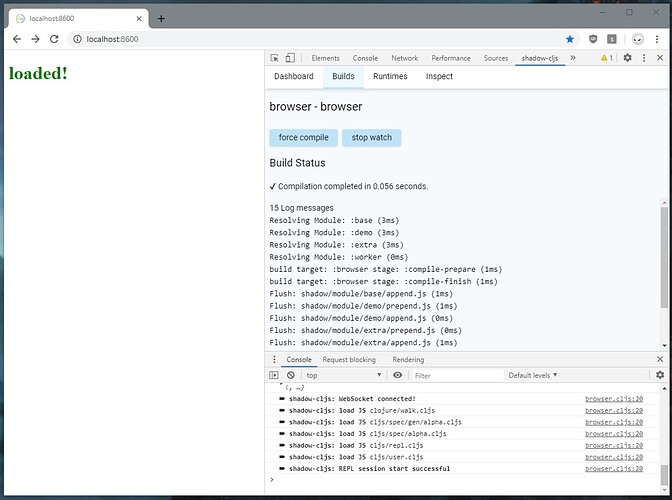
With shadow-cljs 2.8.67 I released the first preview of the shadow-cljs “Inspect” feature.
My first goal for this is to provide a console.log equivalent experience for all platforms. console.log in combination with something like cljs-devtools lets you log “large” values and inspect them in a user-friendly manner. It is basically an enhanced println but is limited to the Browser. It doesn’t scale to really large values but is definitely better than prn. It also doesn’t work for node, react-native or CLJ.
The shadow-cljs UI now has a “Inspect” section that will allow you to look at values that were sent by tap> on any of the supported platforms (eg. CLJ, CLJS in the Browser, node, react-native, etc). In future versions this will integrate more directly with the REPL itself (like REBL) but the first iteration is just about tap>. Basically once the runtime is loaded up it will start communicating with the UI and you can inspect all your taps there.
I made a quick video showing what this is about yesterday night (shouldn’t be making videos that late but I hope you get the idea).
The UI should be considered alpha and will change substantially but I wanted to get this to everyone now so I can collect some feedback and maybe get some UI suggestions. I will personally start using this for everything now and ban console.log or prn from my workflow. It has already proven useful for me by allowing me to dig into the shadow-cljs state itself as I showed in the video.
To get tap> support in your project you only need to include the appropriate namespace. This can either be done via :preloads or at the REPL if you just want to try it out occasionally.
-
shadow.remote.runtime.cljs.browserintended for the Browser but currently should also supportreact-nativeas it has nativeWebSocketsupport -
shadow.remote.runtime.cljs.nodeintended fornodetargets and uses thewspackage to communicate with theshadow-cljsrelay
To test this really quickly run
shadow-cljs server
Then open the shadow-cljs web UI (usually http://localhost:9630) and select the Inspect menu option.
You then run
$ shadow-cljs node-repl

cljs.user=> (require 'shadow.remote.runtime.cljs.node)
cljs.user=> (tap> :hello)
or for a quick browser test
$ shadow-cljs browser-repl

cljs.user=> (require 'shadow.remote.runtime.cljs.browser)
cljs.user=> (tap> :hello)
or just include :devtools {:preloads [shadow.remote.runtime.cljs.browser]} in your build config.
I have many more ideas for this and what is available in 2.8.67 is only the beginning. This is currently based on the shadow.remote architecture which I described a little here. For now this is integrated with the shadow-cljs project but will become standalone if there is enough interest. The underlying “protocol” might be useful for tools and could potentially be used as a substitute for nREPL or maybe used via nREPL. Basically everything you see in the shadow-cljs UI is already accessible to other tools if you want it. You could build an entirely different UI. There is nothing shadow-cljs specific in the architecture.
I would appreciate help for the UI design since I’m a really horrible designer and the UX for this has to become better. I’m happy about suggestions on that front. Screenshots/Videos/Sketches are appreciated. For the most part this is inspired by REBL but I’m not really sold on the whole current/next paradigm and it IMHO requires a bit too much screen space. Ideally everything would fit into a “narrow” window somewhere on the sides. Don’t want to dedicate an entire monitor for it. 
PS: Neither Inspect nor shadow.remote are great names … so these might change in the future. Naming is hard …
Edit: 2.8.68 moved the namespaces a bit. Updated to match the new ones.
 I could see myself using this for Clojure development as well.
 I‘d love to see inspection tools integrated with chromium devtools, similar to react/redux/angular/… devtools extensions. I know that‘d be far more inconvenient to maintain for a library author, but it’s just so frictionless (plus, it‘d be very welcoming for folks coming from other ecosystems).
