General note: while I agree that NNs and probabilistic programming languages are not a core part of the expected statistical toolkit, they do each have a place. NNs are receiving enough hype at the moment, but for those of you who might be interested in PPLs, I recommend this video from Stuart Russell to get a sense of what they are and how well they can perform when used properly.
2 Likes
I recently started a text classification project and did in parallel using python and clojure (in my free time at home).
I don’t have the impression that the combined Clojure / JAVA world misses a lot for any type of data analysis.
This has as a consequence that I need to embrace Java and not try to avoid it.
After some experience i came to the conclusion that Java inter-op is not a problem as such, but the “tooling” for Java Interop could improve.
Even the most complete Clojure IDE’s (Intellij + Emacs+CIDER) don’t have “perfect” autocompletion or help on Java methods each time it would be possible. (It can never work always, due to Clojure being a dynamic language)
But I think we will get there, as the toolling keeps improving.
I got as well the impression that “wrapping” existing Java libraries is mostly a waste of time and should not be done. I saw a lot of abandoned “wrapping” projects. They were probably abandoned, because it is simply too much work to “wrap” the always changing Java library.
In any given project, I need only a very small subset of the big “Java data science librarys” and it is therefore easier to write a small wrapper my self, only for the code I will call.
The huge difference in using Python vs Clojure I saw in the ease of “searching solutions in stackoverflow or google”.
For every problem I had, I found the python solution in a few seconds, while for Clojure it took far longer.
So we should invest more time in blogging about our Clojure based data science projects then spending time in wrapping Java code.
3 Likes
I’ve been given a new ‘status’ and can reply again - whoohoo!
In Saite, this is just:
(->>
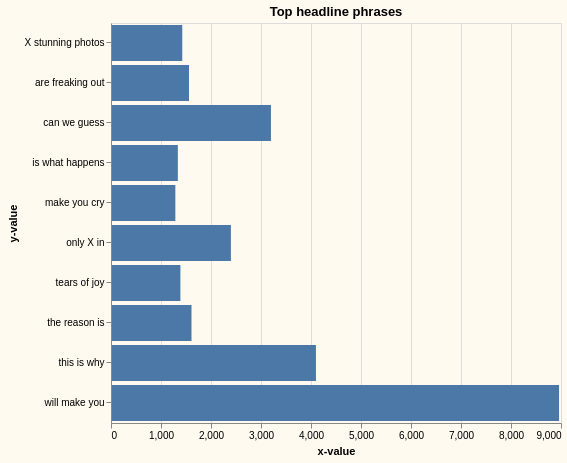
(hc/xform ht/bar-chart
:TITLE "Top headline phrases"
:X :x-value :Y :y-value :YTYPE "nominal"
:DATA
[{:x-value 8961 :y-value "will make you"}
{:x-value 4099 :y-value "this is why"}
{ :x-value 3199 :y-value "can we guess"}
{:x-value 2398 :y-value "only X in"}
{:x-value 1610 :y-value "the reason is"}
{:x-value 1560 :y-value "are freaking out"}
{:x-value 1425 :y-value "X stunning photos"}
{:x-value 1388 :y-value "tears of joy"}
{:x-value 1337 :y-value "is what happens"}
{:x-value 1287 :y-value "make you cry"}])
hmi/sv!)
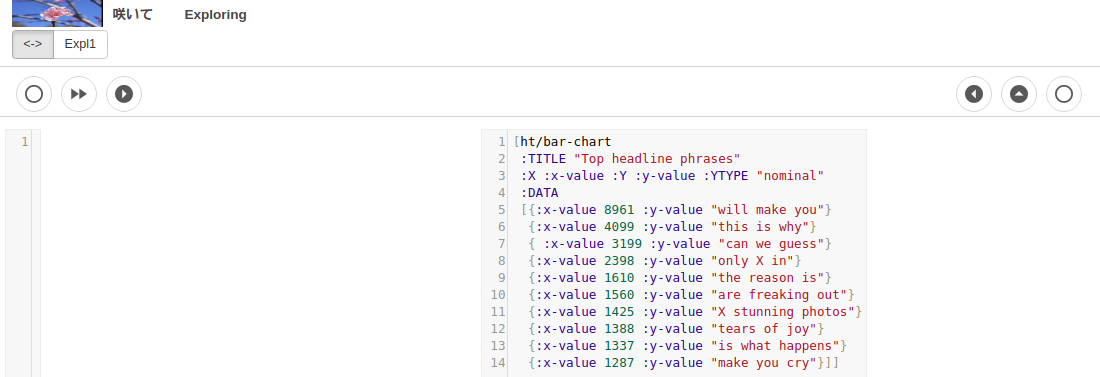
Actually, for something this simple we don’t even need the server. We can just use the client editor and popup render to check if it looks like what we want:
sigh more platform limitations - you cannot have more than 3 consecutive comments/replies. So, I have to edit this original in order to add the following which probably should be separate.
Just occurred to me that it is probably worth noting that if you would be working with many datasets with the same x/y channel names and types, you could simply change the defaults for those channels so that you would not need to keep specifying them in your explorations:
(hc/update-defaults :X :x-value, :Y :y-value, :YTYPE "nominal")
;;; Now the above example could be
(-> ht/bar-chart (hc/xform :TITLE "Top headline phrases") hmi/sv!)
Same with the client. The editor content would just be:
[ht/bar-chart :TITLE "Top headline phrases"]
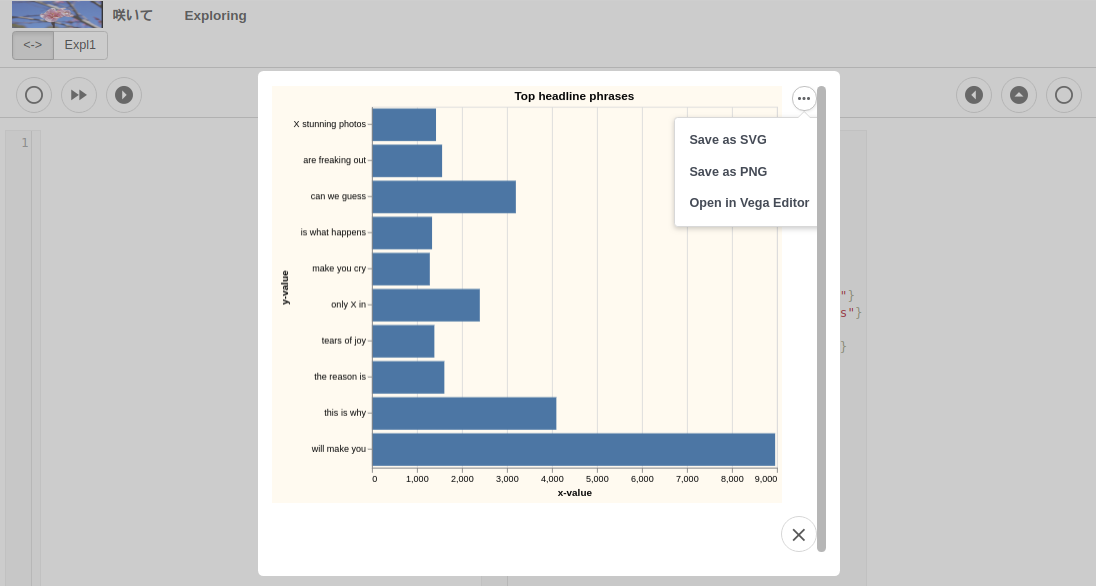
And the renderings would be the same as before
3 Likes
The ergonomics of this platform are bit difficult to navigate correctly. This should have been this reply, not a new comment:
Sure, but I believe Saite (by way of Hanami) is simpler, with an even lower “boilerplate”, and much more capable. You can certainly use it in exactly the same way as Oz (a Vega/Vega-Lite spec is a legal template), but you can do a lot more with very little extra effort.
This example worksheet shows how one may use Renjin (a pure-JVM port of R) from Clojure.
It will be generalized as a library we are building – would be thankful for comments!
Renjin is possibly the largest collection of statistical functions in the JVM (but many R libraries are not supported yet).
3 Likes
My comment wasn’t meant to express a preference between Oz and Saite/Hanami (I haven’t used the latter, and thus have no opinion), but rather to suggest that there are advantages to targeting a browser via VEGA rather than, for example, building a Grammar of Graphics implementation in clojure or wrapping R’s ggplot.
1 Like
What I like about the python community is that although there are competing libraries and a lot of overlap, every single library has a very strong statement of intent as well as a defined set of features.
I find this lacking in clojure to the point where just by going through the thread, I’m reading about what everyone’s done but I’m still confused as to how different libraries can be combined together to do something greater.
Tutorials are a great start but my preference would be that a standard be chosen for me and I’ll just go with it. I don’t need 5 ways of doing the same thing. I need 5 things that when combined, gives me much more flexibility than before. It’s the same with libraries as with functions. Right now, as a beginner, I do need some help with this.
6 Likes
I totally second this, though in Python there are a ton of libraries, for doing these things people will fire up a Jupyter Notebook, import pandas, numpy and scikit-learn and that’s it. Now you might like or not these packages/libraries (for instance I dislike notebooks), but at least it’s going to be clear to beginners how to start.
After some time when they are more independent and have the ability to evaluate code & packages they might choose something else, but then who cares.
I guess the point is similar to what Cognitect has said many times: they chose to build stuff for experienced programmers, we will have to choose whether we want to do the same or improve support for the beginners.
2 Likes
This reminds me: while I think everyone should use what they like, I find notebooks worse than a good editor connected REPL for most work. It would be nice if we tried to center our work around libraries that work well in a normal Clojure REPL+editor workflow while leaving the option open for Jupyter (or whatever) on top.
5 Likes
I’d like to see many existing projects merged into one very good set of libraries, as I agree with the point made above that the Clojure community too small to support as much fragmentation as one sees in the Python world.
3 Likes
I think you should aim at RStudio, tidyverse, rstan, Rmarkdown, etc of R Language.
2 Likes
We use kixi.stats for doing an MCMC like model for special education projections. We’re doing some discrete event simulation work at the moment, but that is in python using simpy (code not released yet).
I’ve found two other discrete event simulation libraries:
I think these kinds of simulations are important parts of data science too and I’d like to see good libraries for them.
3 Likes
Speaking of visualization I’d just throw out there thing/geom. In my limited experience the whole thi-ng library collection has been well thought out and integrated - so I’d just encourage people working on library to at least look at whats there for inspiration.
I also quite like how it’s all built on top of SVG. Compared to some other libraries there are no layers with notebooks and JS libraries supporting it from below. So for what I was working on it was easy to just have the library spit out an SVG and then push the SVG into a JavaFX window (with some fn-fx)
Unfortunately it’s not very “data science” oriented and you do need to twiddle the knobs a bit to dial in a look. But most of the work has already been done and the full suit of thi-ng tools just seems very powerful
4 Likes
thi.ng.geom.viz has a lot of what we want. I wonder if the vega/vega light grammar is the way to go and then we can feed the results to either something vega or thi.ing based.
4 Likes
This is indeed very cool…
How do you see the future of Rejin, compared to FastR (so a R implementation running on the Gralls JVM).
I need to confess, that I am doubting for both, that they will ever work for ALL R libraries, giving the large percentage of “native” among the R libraries.
But maybe I am wrong.
1 Like
Hi @Carsten_Behring!
At the moment, it seems that both Renjin and FastR are very partial in their coverage of working libraries. My everyday workflow is with Rojure, your library.
Even if it stays partial, Renjin may be useful to us, since it does offer a huge collection of well-tested and well-documented statistical functions. These could be wrapped as a Clojure statistical library, without any need to exit the JVM.
FastR will be interesting if we decide to target GraalVM as a main platform for Clojure data science. I know too little about GrallVM. It may be a wonderful opportunity, which is important for us to learn.
I’ve never quite figured out what thi.ng/geom is built on. The way Vega-Lite and Vega work is that Vega-Lite has a compiler which generates Vega. Vega in turn has a compiler which can target different lower level runtime backends - D3, HTML5 Canvas, WebGL, possibly others. So, in theory, it may be able to target whatever is under geom.
1 Like
There is nothing under geom really. Works well in clojure and clojurescript.
4 Likes
fwiw I have used nvd3 with Clojurescript for plotting in a browser. It’s nice for what it is, which is a D3-based chart library with added conveniences. You do have to descend to D3 some of the time–at least I did for my project–which is probably not what people here would want in general. (D3 has a significant learning curve.)
I don’t know most of the plot libs that have been mentioned, though I’ve done a bit of plotting with R and with Incanter, and with plplot via OCaml’s Owl scientific library.
1 Like
My idea of development: everything is RMDB. Playing table tennis between Clojure and RMDB.
           R System -> RMDB, Chrome
                DSL -> HoneySQL, hiccup
         R Language -> SQL, html
JRI/RServe/Rsession -> JDBC, ring

------------------
               Clojure -> DBMS, Super Foxpro
                   STM -> Transaction,MVCC
Persistent Collections -> db, table, col
              hash-map -> indexed data
                 Watch -> trigger, log
                  Spec -> constraint
              Core API -> SQL, Built-in function
              function -> Stored Procedure
             Meta Data -> System Table
I use the R language for data analysis and visualization through JRI and DSL(Like hiccup, honeysql) on Clojure, use Chrome to view data (format to HTML), and use the free image-viewer software to view plot.
1 Like