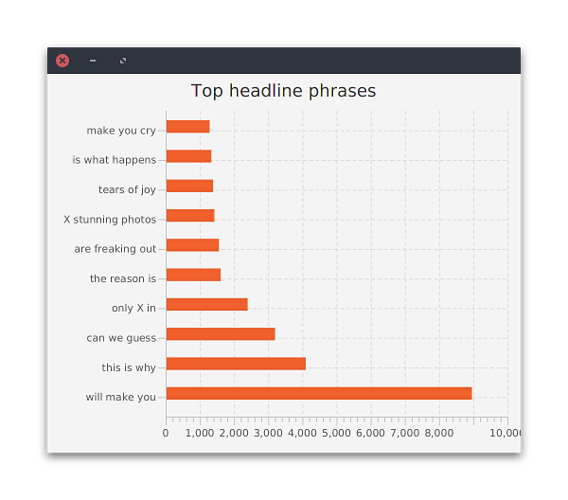
Actually, I think the plotting/display capabilities are well underway. Thanks largely to the amazing work of the IDL folks who have given us Vega and Vega-Lite.
For plotting and charting with zero web dev knowledge, have a look at Saite, a general exploratory visualization app built on Hanami. You can work in the client (browser) and / or from an IDE/editor of your choice on the server side. Saite is evolving toward a new notebook capability. There are a number of issues about this (on the github) and if you think that sounds like an idea worth pursuing, I’d appreciate input on those issues (or others of your own).
If you want to create your own domain specific (or other general purpose) visualization app, look at Hanami. Of course that would involve web dev knowledge. Some new features supporting client only apps are coming. A lot of documentation now, but a lot more coming.
