So I should clarify what I mean by “heterogeneous”: A series of sequence transformations that each have different kinds of work loads. Like:
(=>> (range 100000)
     (map inc)
     (filter odd?)
     ...
     (map super-heavy-function)
     ...
     (filter even?)
     ...
     (map another-super-heavy-function)
     ...
     (apply +))
Big ops, small ops, multiple single-threaded sequencings, multiple multi-thread folding, etc.
And I’m concerned with four different types of complexity here:
- Sequence length -
(range 100000)
- Sequence item size - is it a sequence of ints, nested arrays, massive maps?
- Single transformer difficulty -
(map super-heavy-function)
- Number of transformers, of a few different types, in a thread
My testing has been trying to measure the cost of each of those independently of one another. When I say heterogeneous workloads, I mean any combination of 2, 3 and 4 are potentially non-uniform. And we can measure heterogeneity along each of those axis as well.
Good point about auto-tune, @didibus I was thinking about hot-swapping out fold for pipeline, under the hood, for small sequences. Turns out a small fix to the fold =>> impl makes it catch up to |>> in most cases where it lagged behind.
Really, I kinda wonder if some kind of jit/profiling is going on inside Fork/Join, where if a workload is embarrassingly single-threaded, it smartly keeps most of the process local to a particular thread.
And large core count and workloads do better in pipeline ?
That’s no longer obvious, after my fix with 0.1.0-alpha.14. I had originally found this scenario where |>> appeared to perform 2 to 3 times better than =>>:

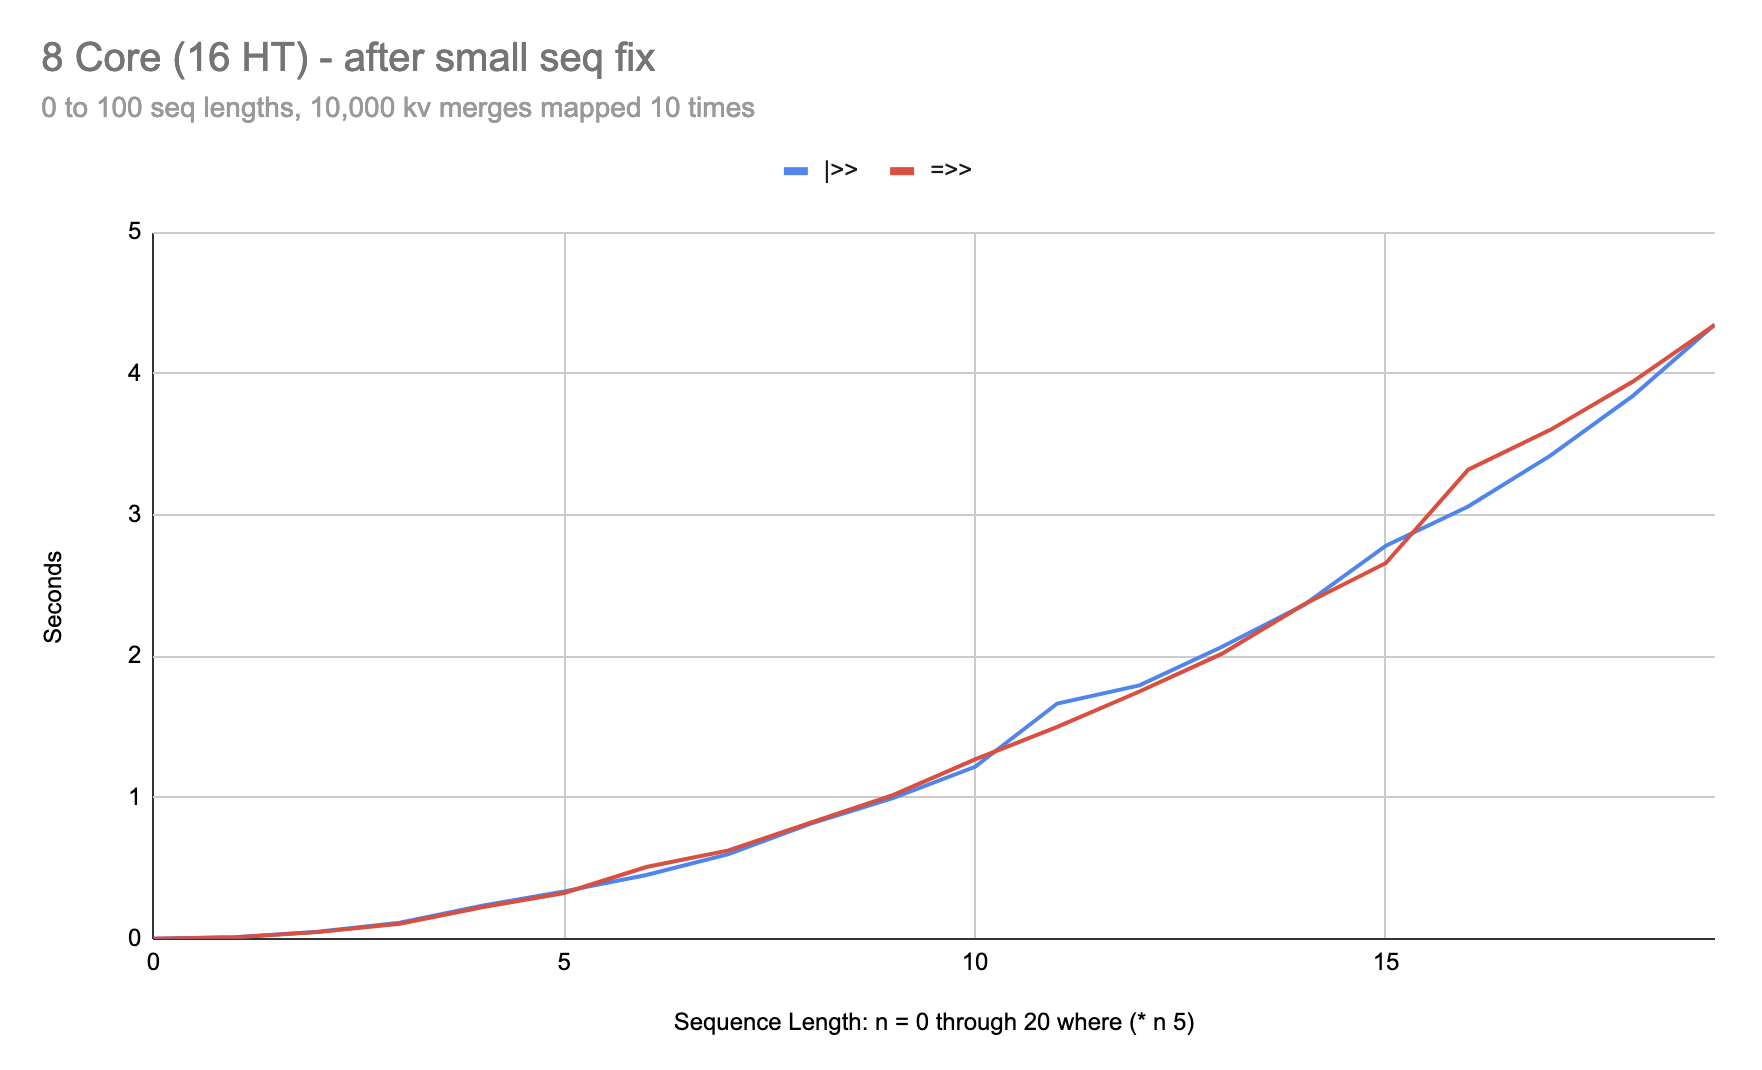
We’re only measuring sequences of 0 through 3 length here. But if we zoom out, we can see that the problem disappears for =>> with longer sequence lengths:
(dotimes [n 20]
  (let [m (mk-m (* 10000 n))]
    (println
     (qb-val ; <- using quickbench in some of these tests
      (=>> (cycle [{}])
           (take (* 5 n))
           (map #(merge % m))
           (map #(merge % m))
           (map #(merge % m))
           (map #(merge % m))
           (map #(merge % m))
           (map #(merge % m))
           (map #(merge % m))
           (map #(merge % m))
           (map #(merge % m))
           (map #(merge % m))
           last)))))
On an 8 core:
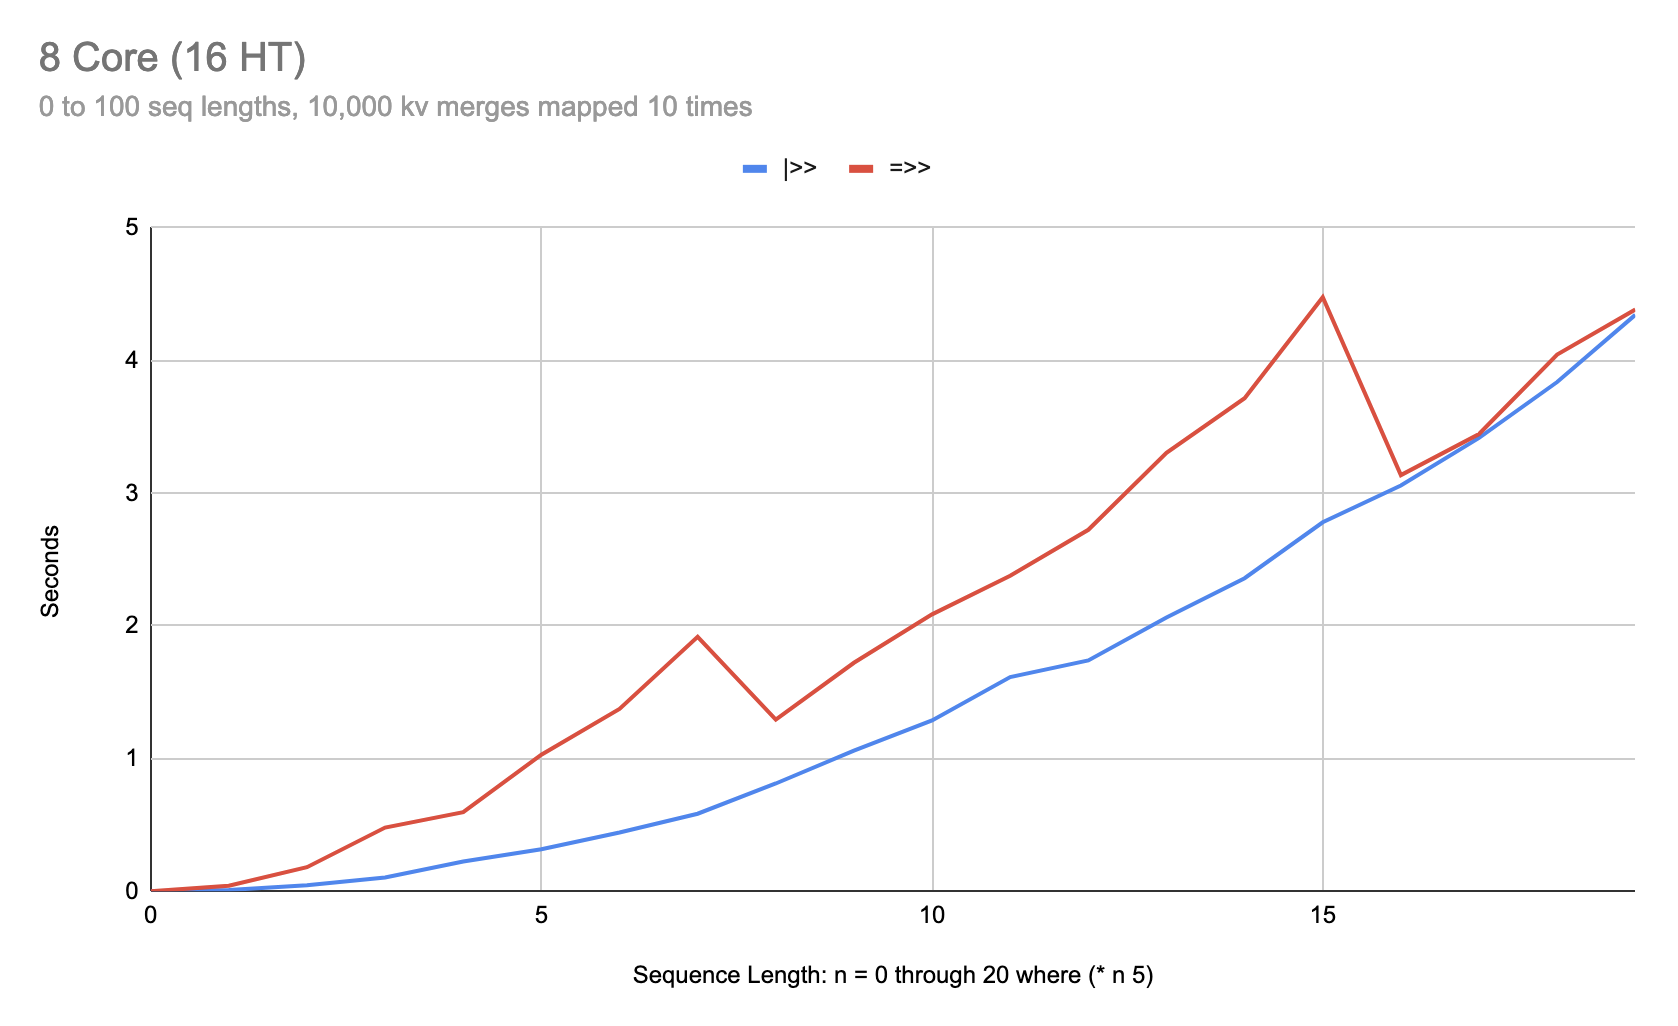
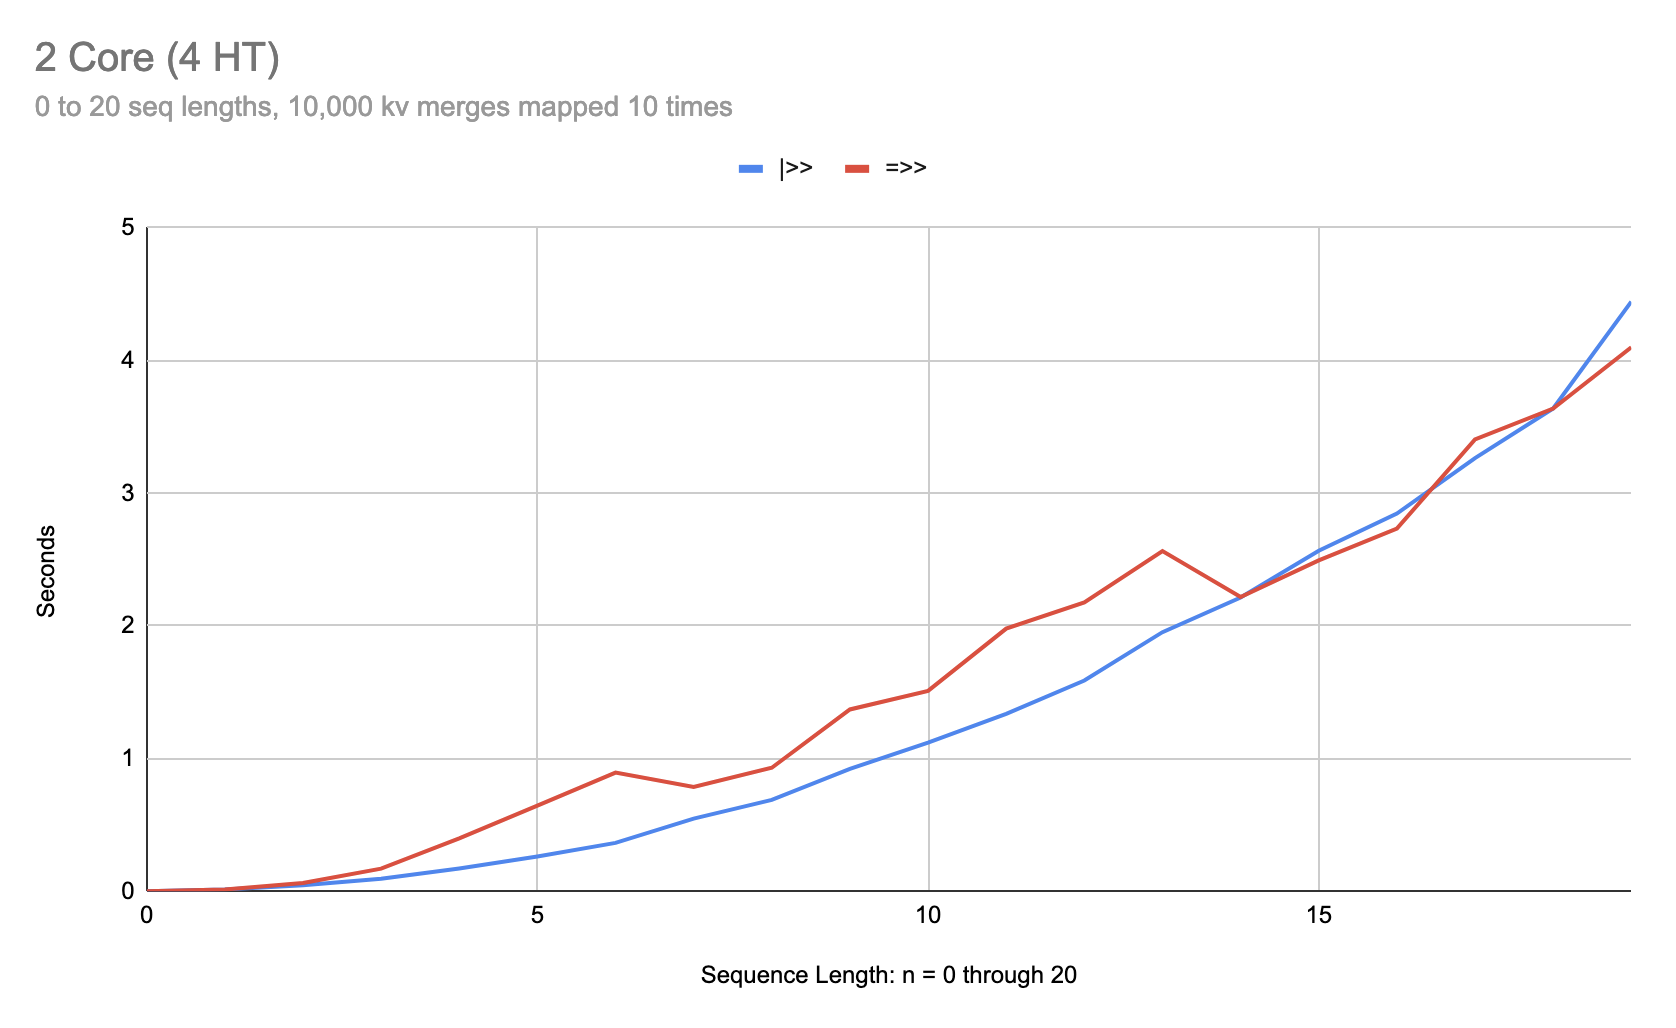
To dial in this behavior on the 2 core machine, I needed to tweak the code a bit:
(dotimes [n 20]
  (let [m (mk-m (* 10000 n))]
    (println
     (qb-val
      (|>> (cycle [{}])
           (take n)
           (map #(merge % m))
           (map #(merge % m))
           (map #(merge % m))
           (map #(merge % m))
           (map #(merge % m))
           (map #(merge % m))
           (map #(merge % m))
           (map #(merge % m))
           (map #(merge % m))
           (map #(merge % m))
           last)))))
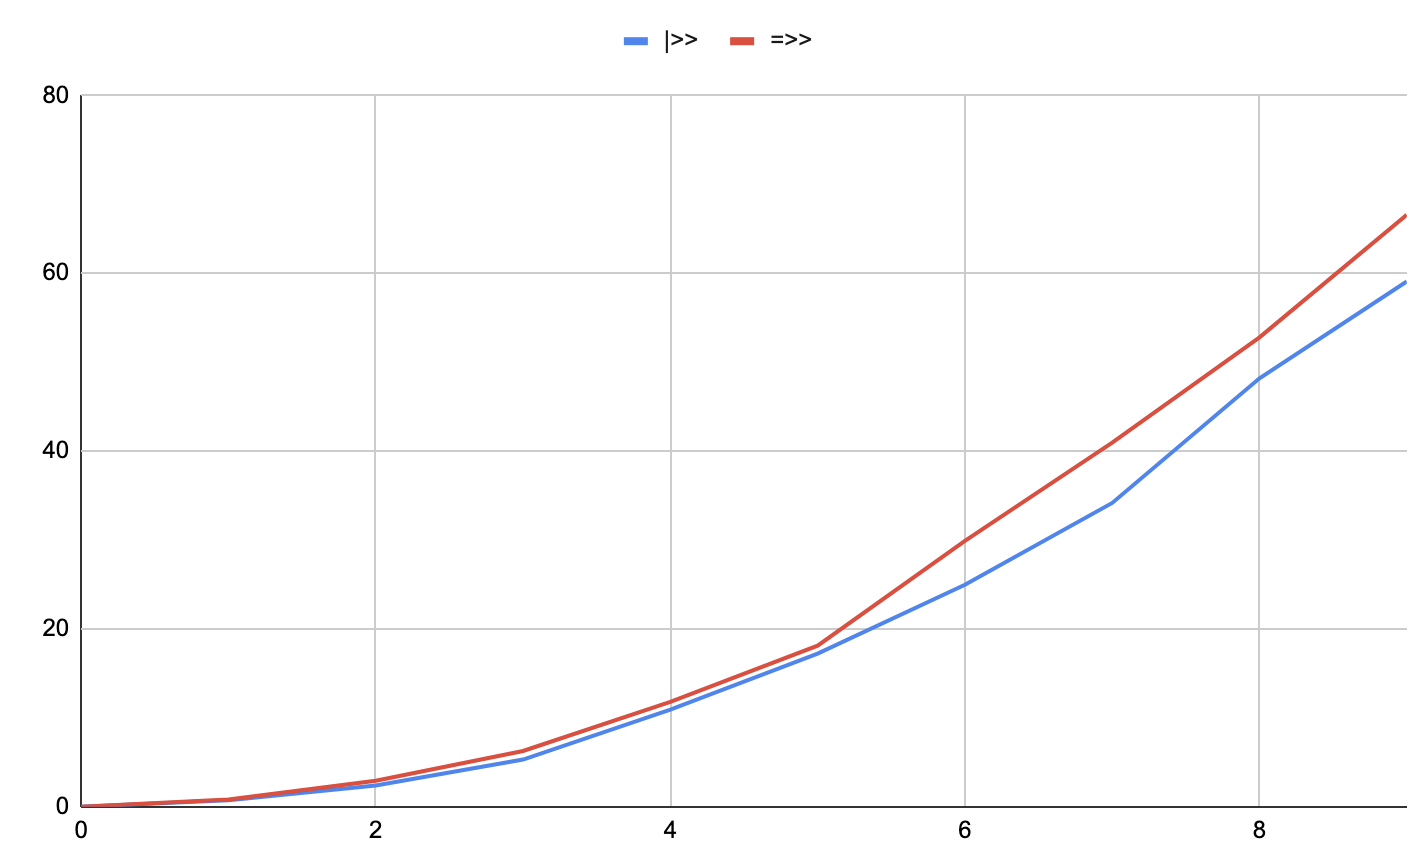
On 2 core:
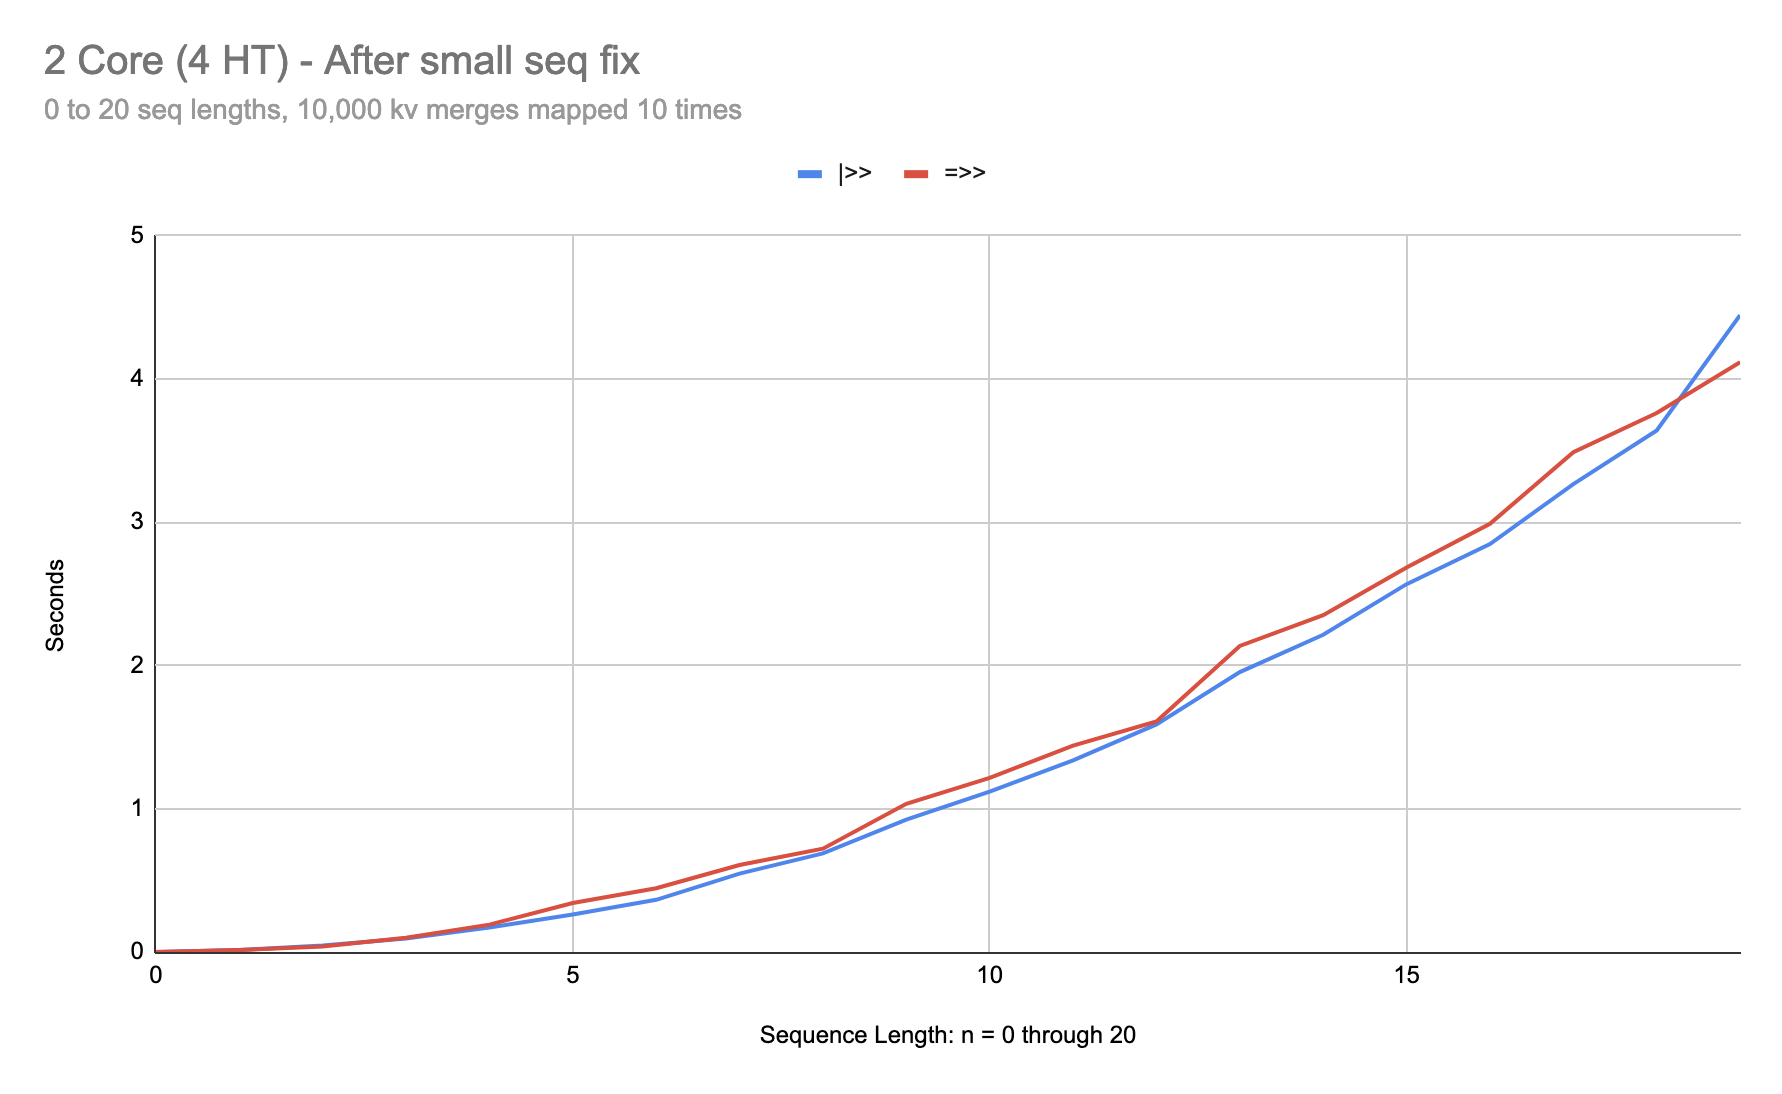
As you can see, at sequences six items in length, |>> can be over 3 times faster than =>>. After the fix in 0.1.0-alpha.14, this anomaly is fixed:
And on 2 core:
So now it’s pretty hard to find scenarios where |>> does significantly better than =>>.
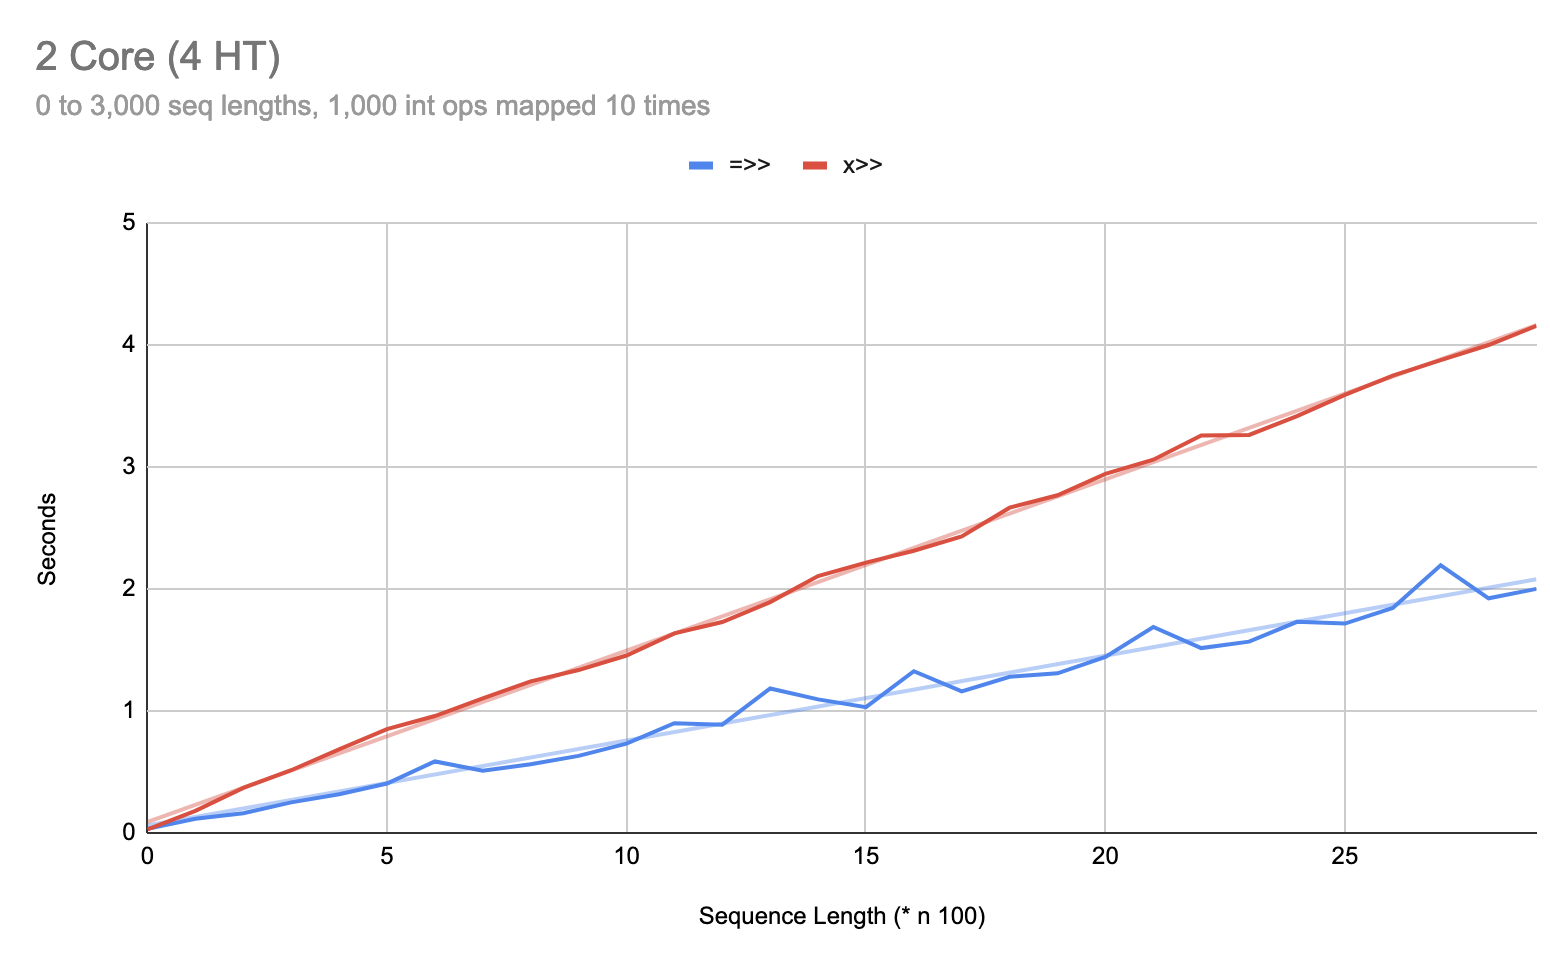
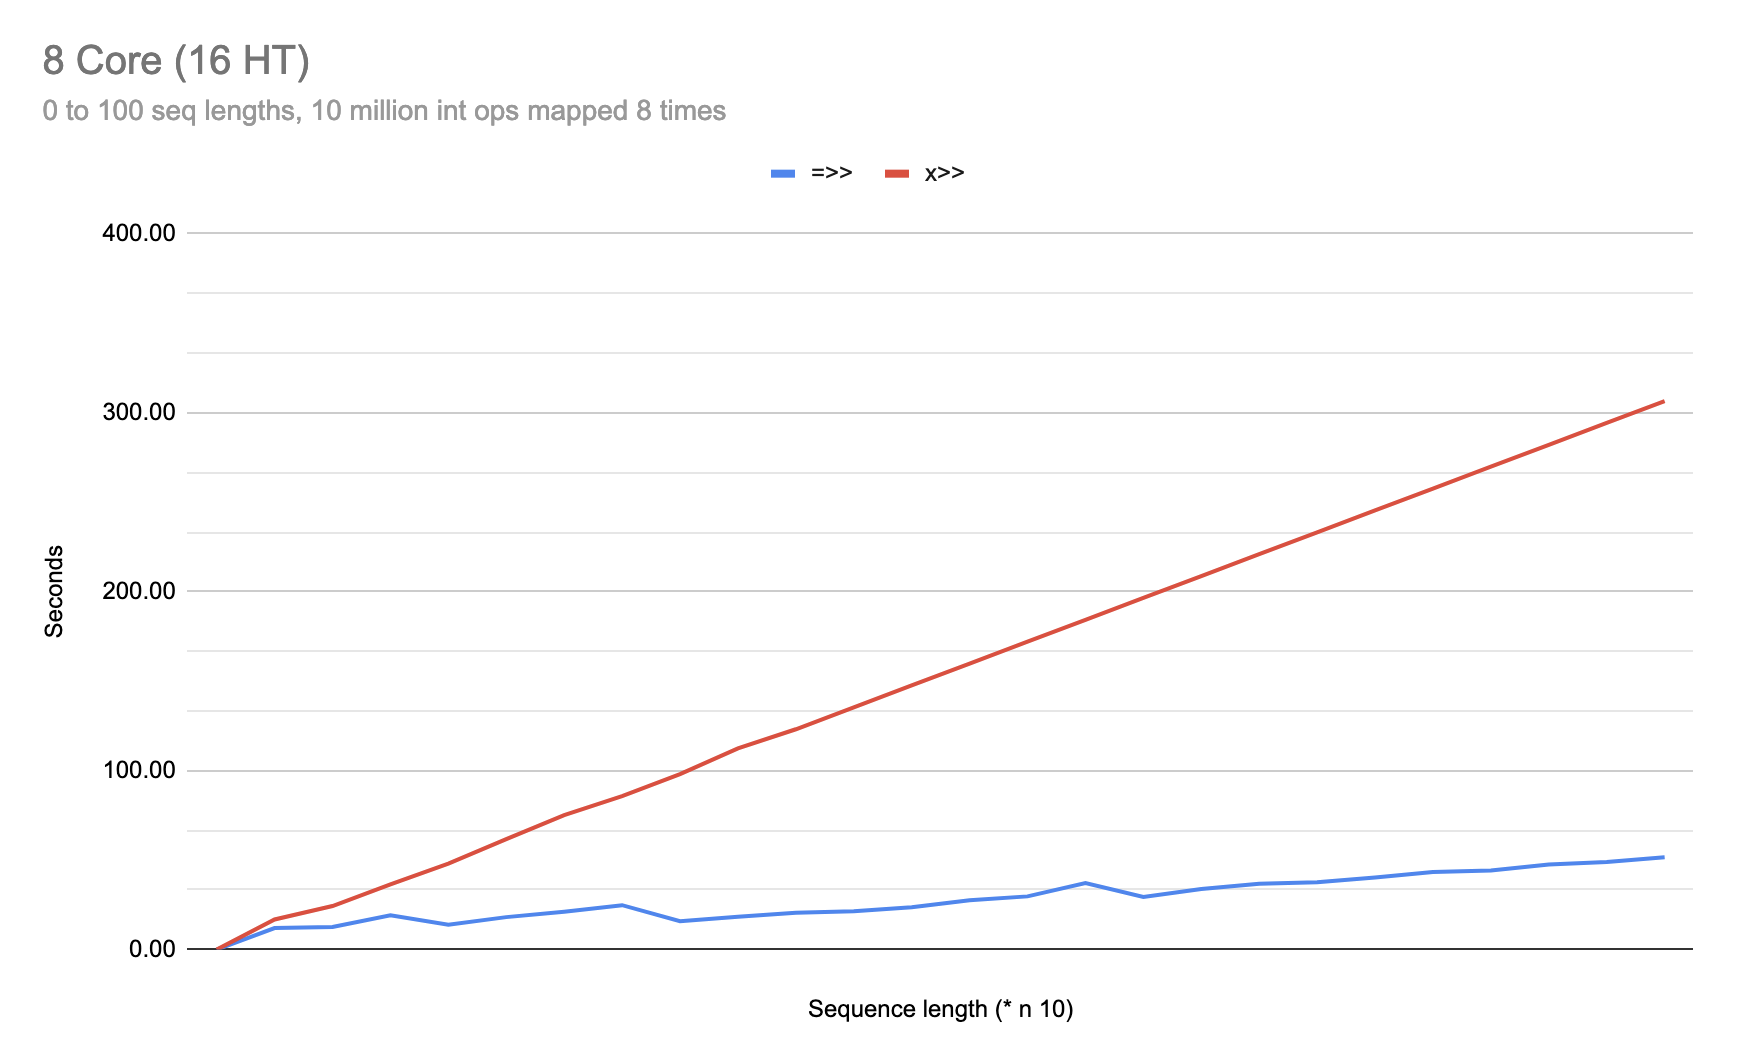
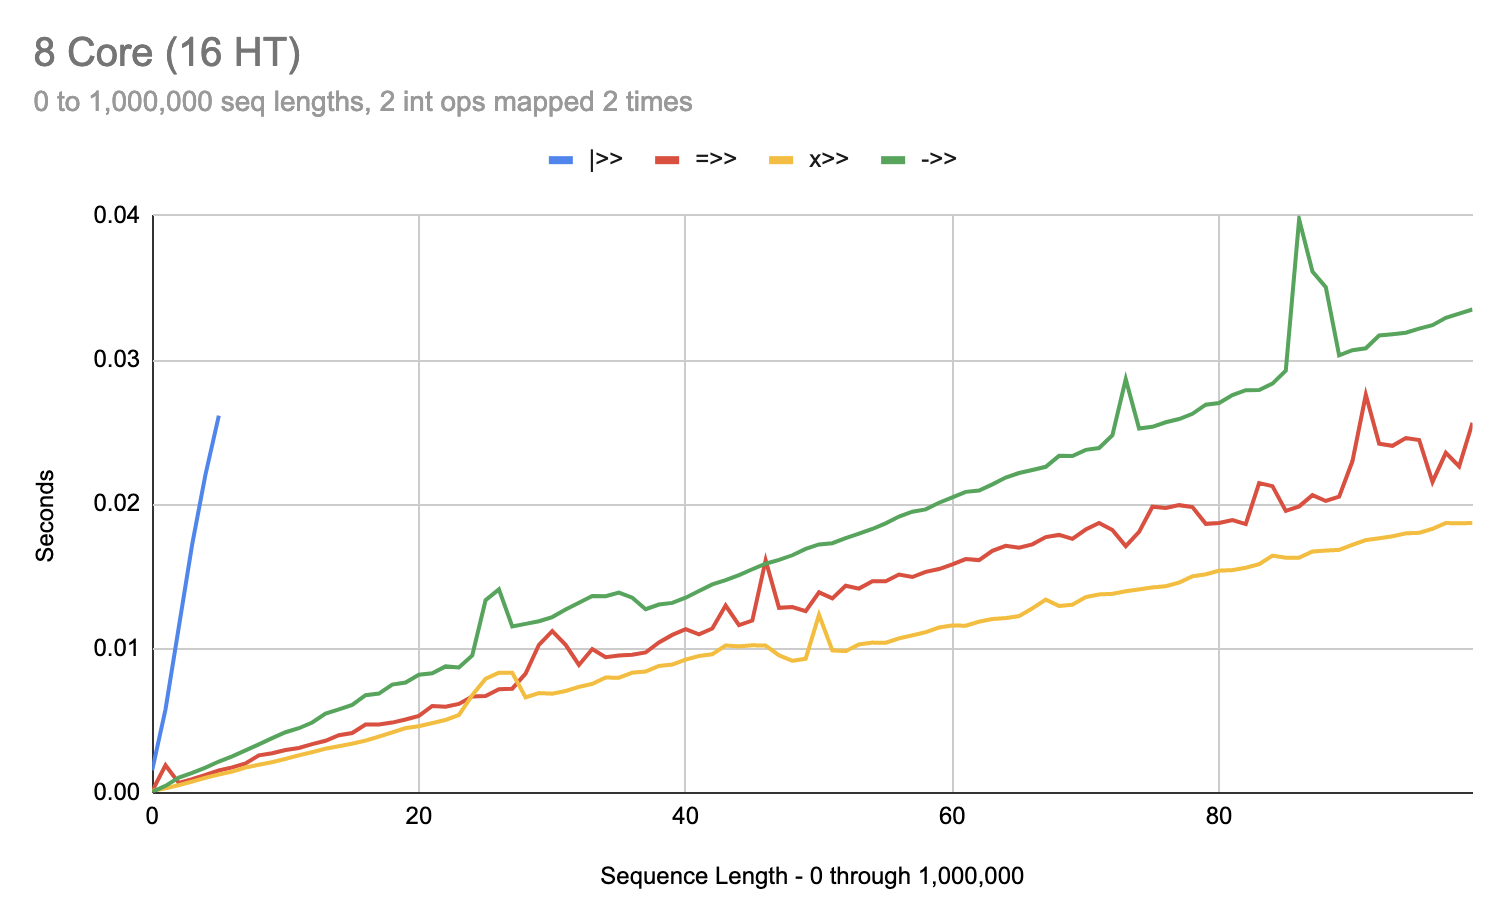
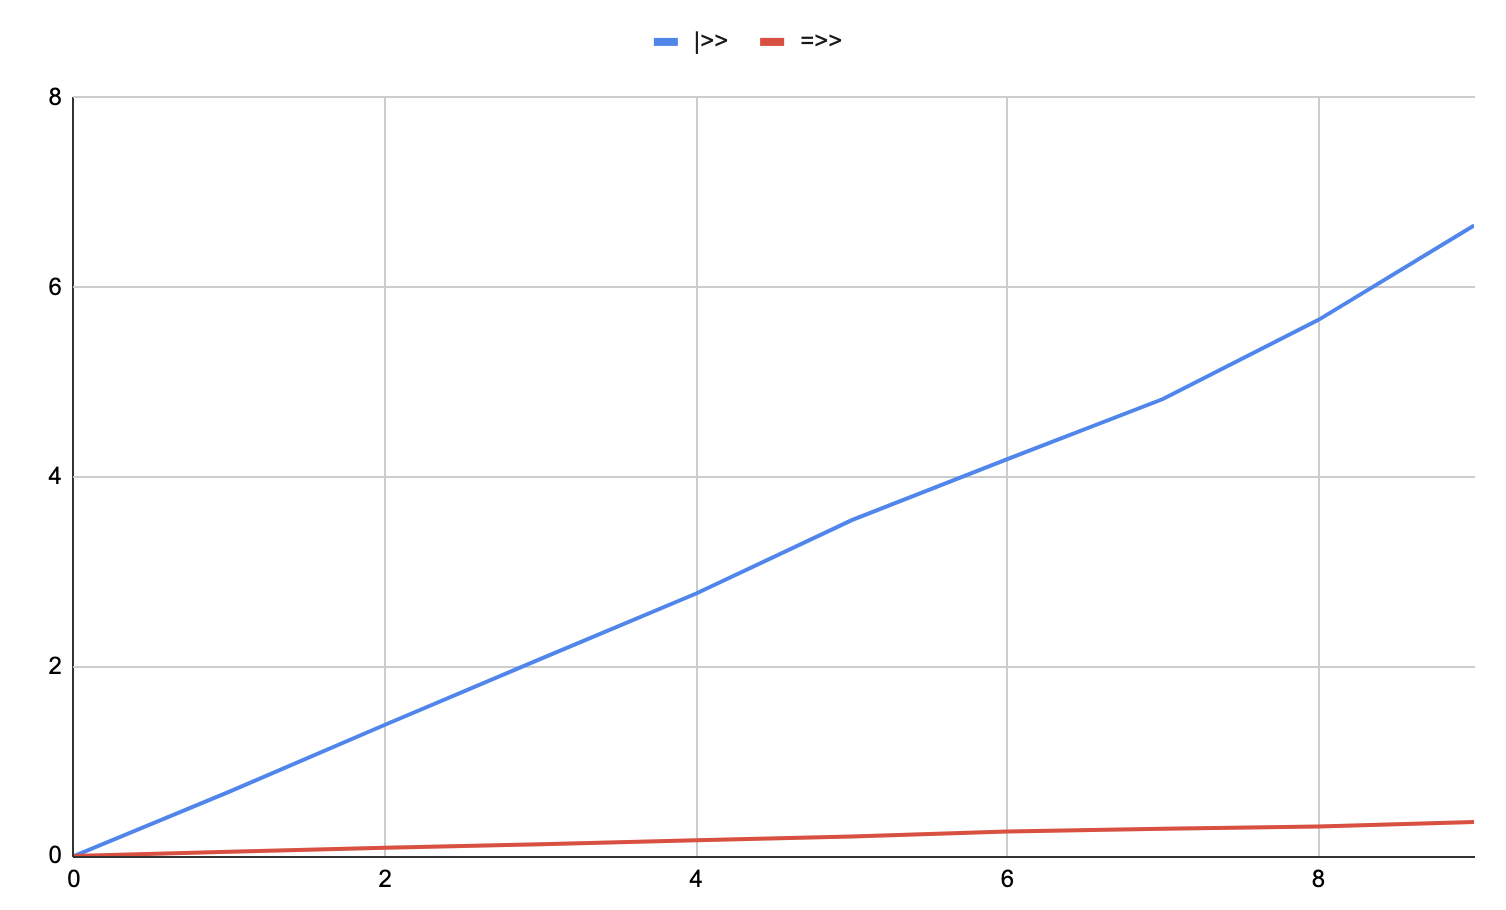
So, in what situations does =>> do significantly better than |>>? Many, especially with long sequences. Let’s look at a very basic scenario:
(dotimes [n 100]
  (println
   (time-val
    (|>> (range)
         (take (* 1000 n))
         (map (flip 2))
         (map (flip 2))
         (apply +)))))
As we can see there,
|>> is horrible at small work over long sequences. Amazingly,
=>> is already beating out the lazy version. It’s almost as if
=>> has no (or very little) thread overhead on these semi-light-weight examples.
If we increase the work over time, however, we can see |>> start to catch up:
(dotimes [n 100]
  (println
   (time-val
    (=>> (range)
         (take (* 1000 n))
         (map (flip n))
         (map (flip n))
         (map (flip n))
         (apply +)))))
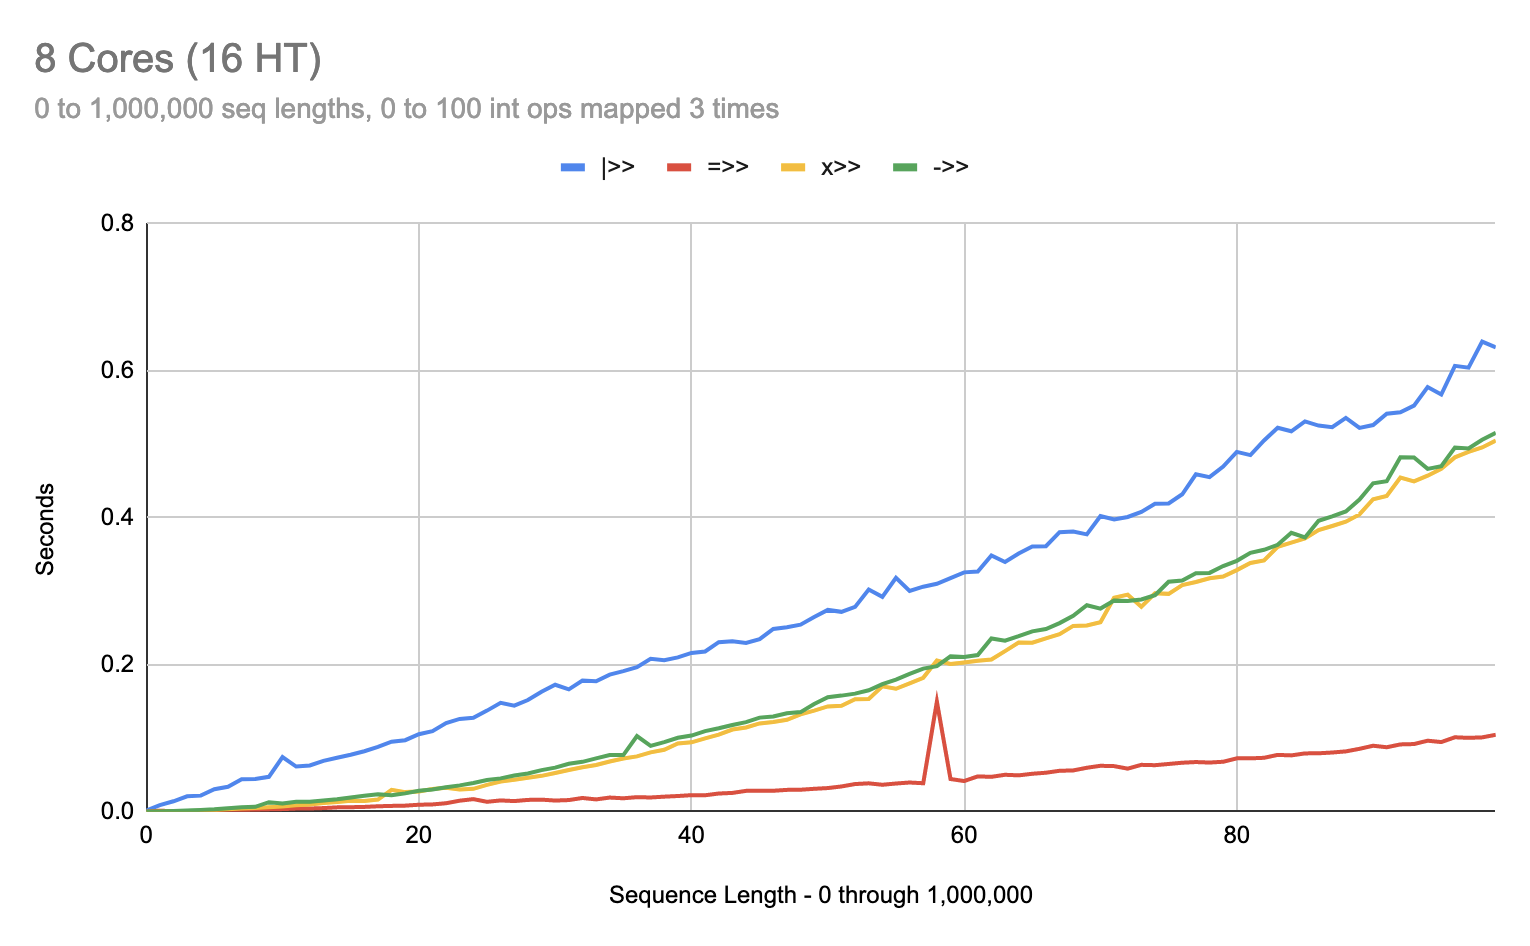
Bump it up a little more and we can see the break even point for
|>> against the non-parallelized variants:
(dotimes [n 100]
  (println
   (time-val
    (->> (range)
         (take (* 1000 n))
         (map (flip n))
         (map (flip n))
         (map (flip n))
         (map (flip n))
         (map (flip n))
         (apply +)))))
At around 600,000 seq length, over 60 int ops, over 5 mapping transforms, |>> starts to pull ahead of the single-threaded versions.
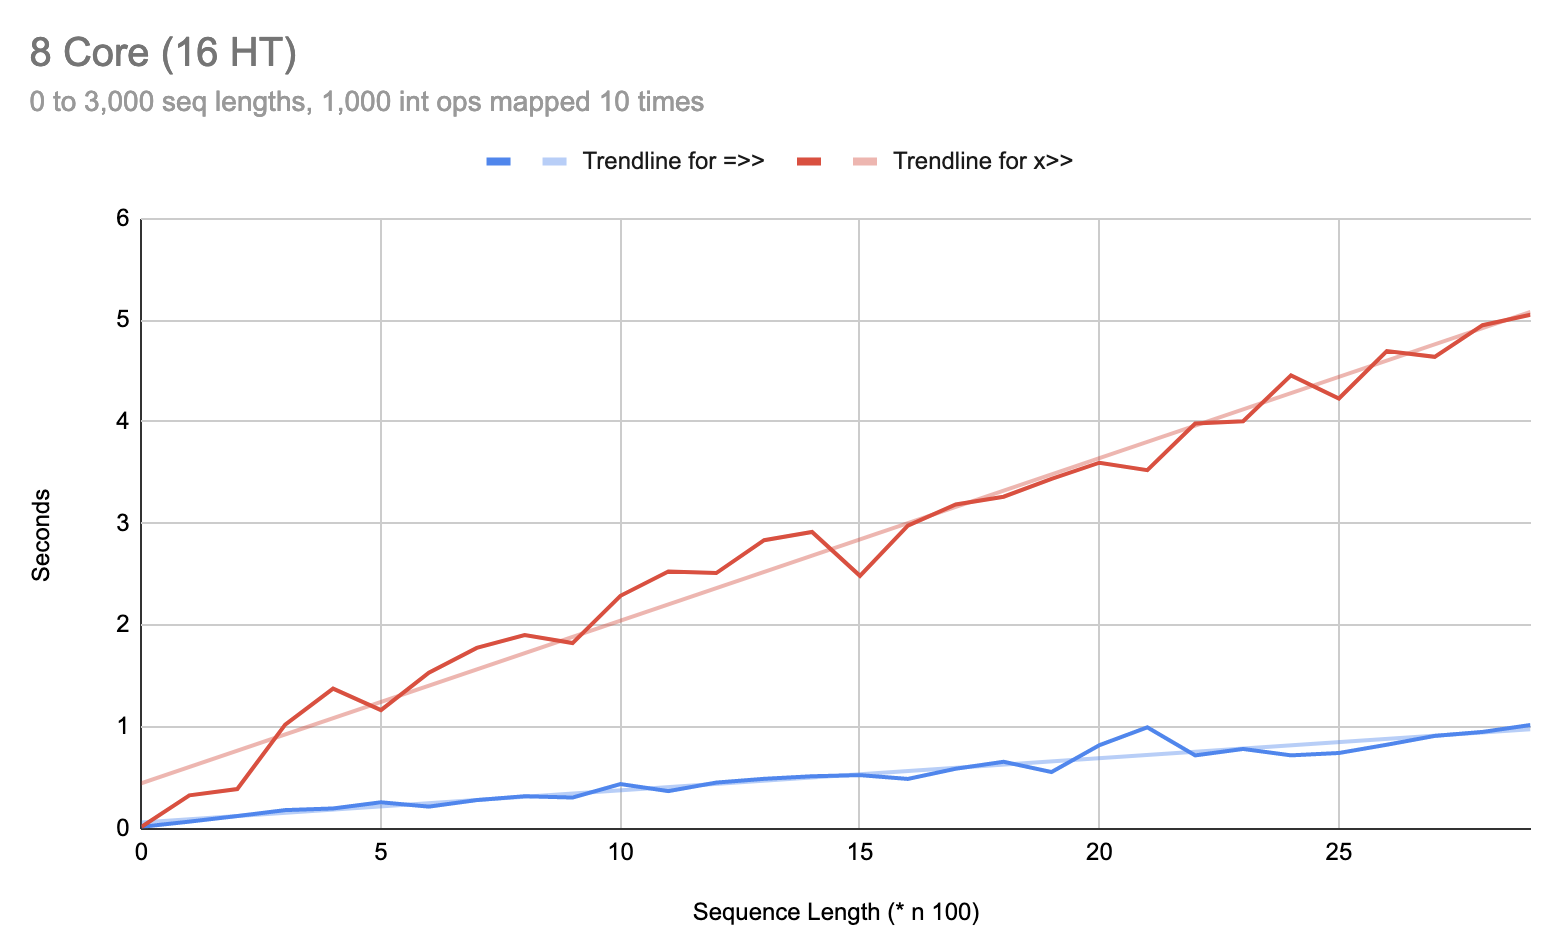
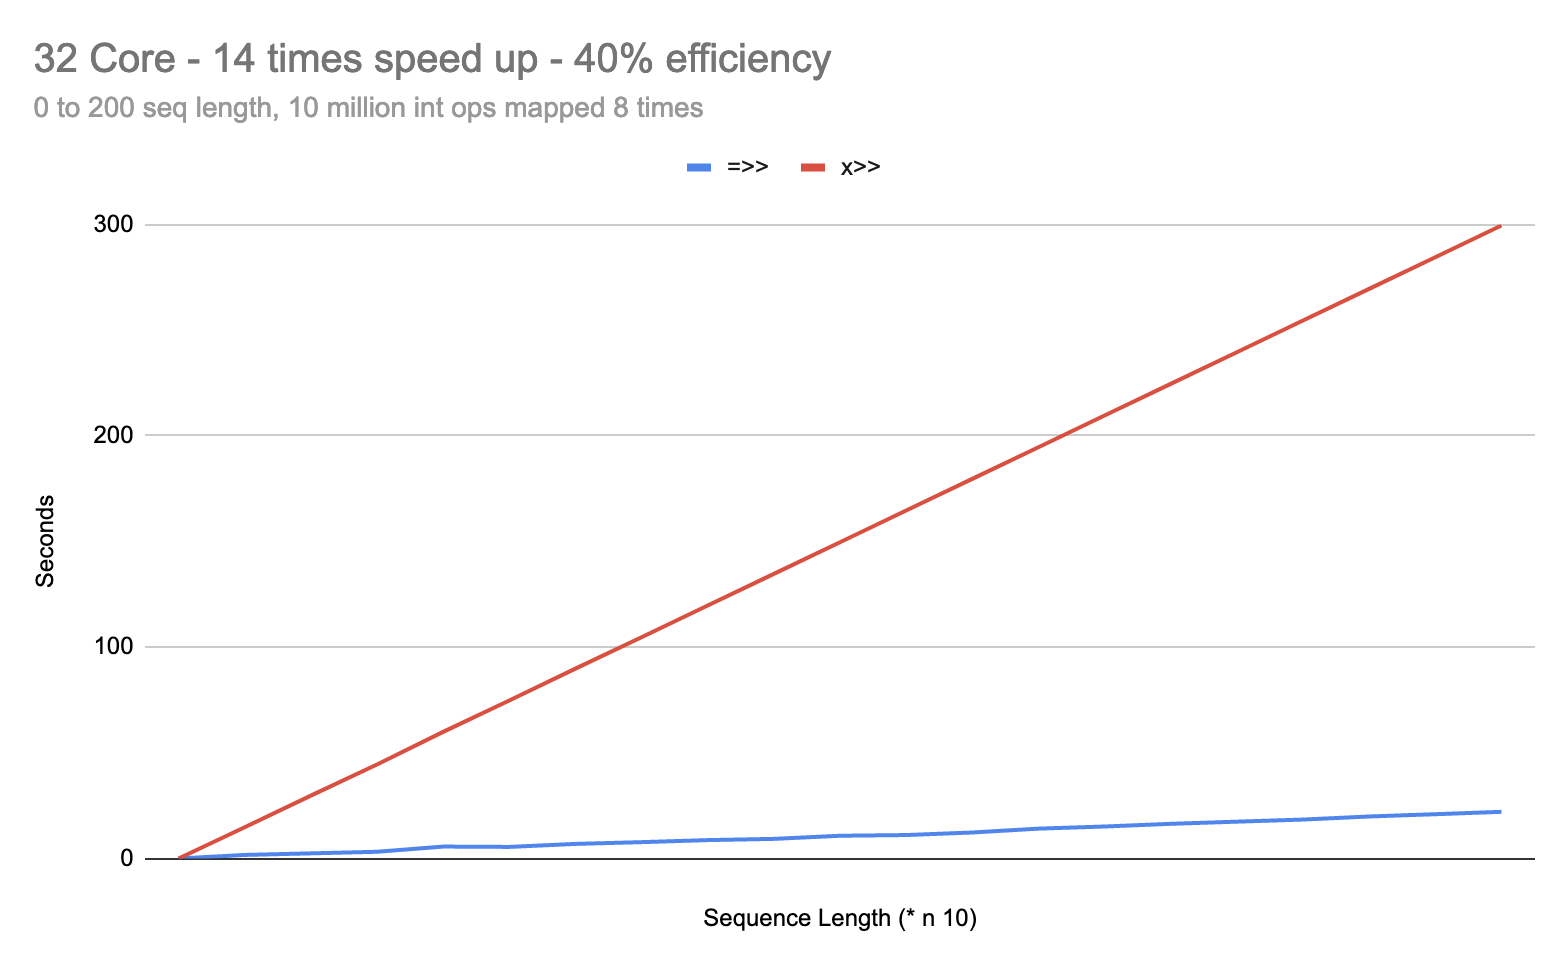
Let’s crank the work way up and see what happens:
(dotimes [n 100]
(let [w (* n 100)]
(println
(time-val
(x>> (range)
(take (* 100 n))
(map (flip w))
(map (flip w))
(map (flip w))
(map (flip w))
(map (flip w))
(map (flip w))
(map (flip w))
(map (flip w))
(map (flip w))
(map (flip w))
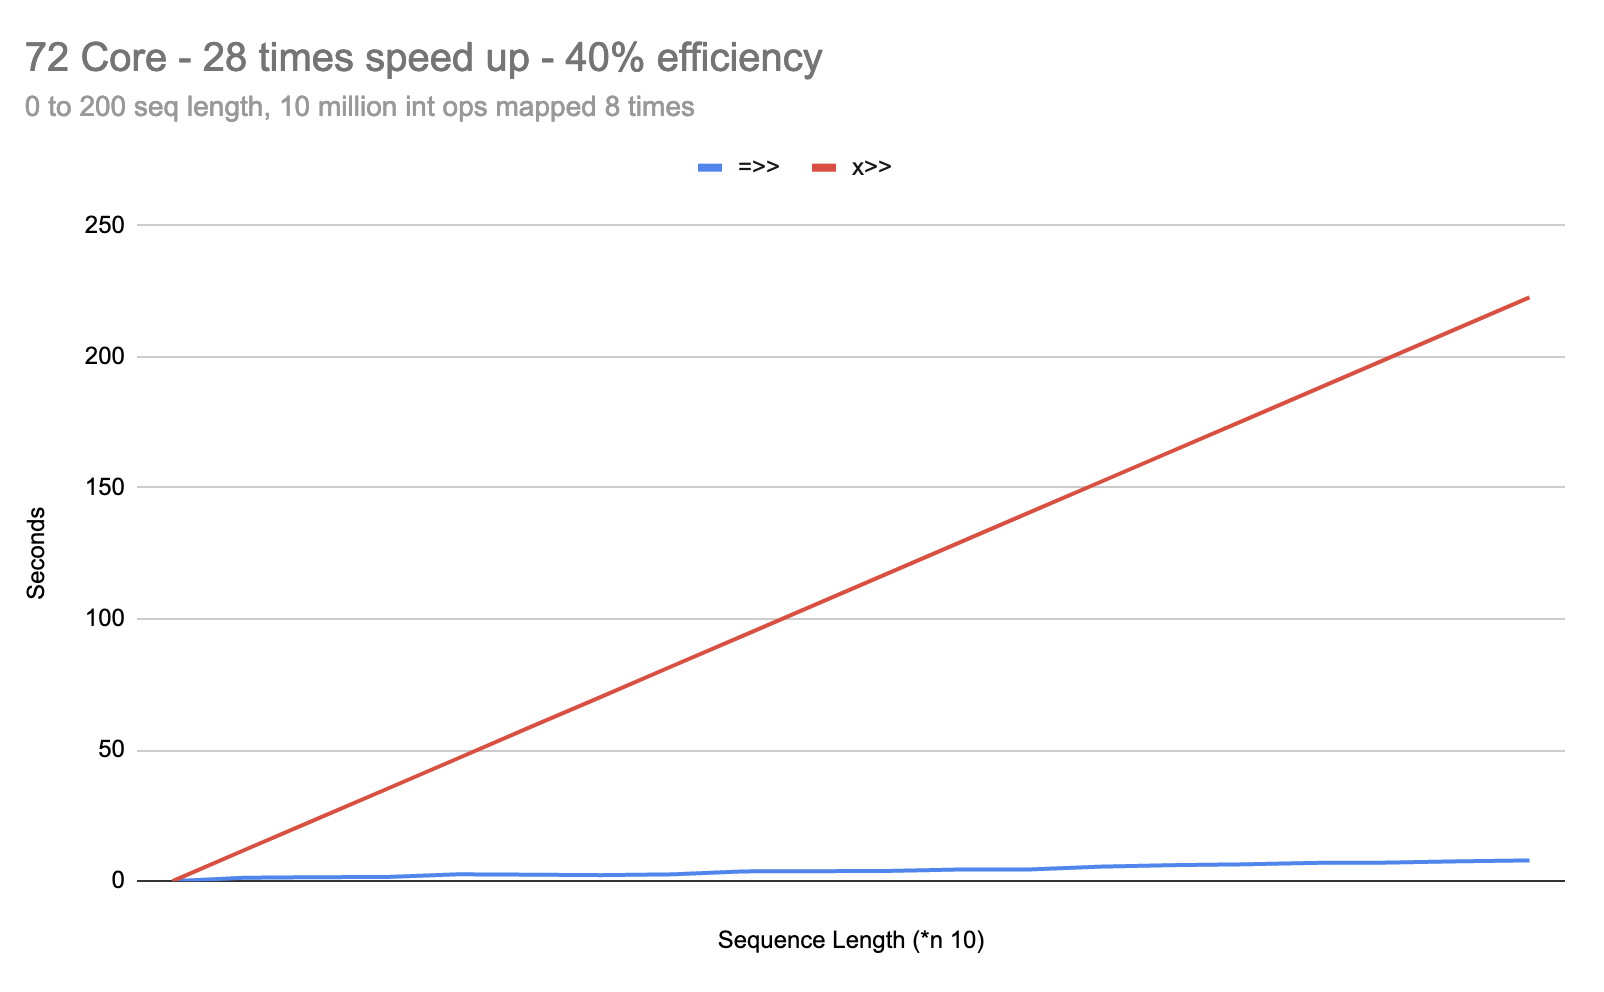
(apply +))))))
And right there we can see that once our transformers are sufficiently saturated with work, the differences between =>> and |>> disappear and, notably, the differences between x>> and ->>/+>> also disappear.
Does that help explain some of the differences between these different thread macros?
Still exploring, but if I can’t find workloads where |>> pays significant dividends over =>>, I may end up removing |>> altogether, just to remove the footgun.
In the above analysis, I would consider all of these homogeneous or uniform workloads. Next up, I’m looking into heterogeneous, non-uniform workloads. There’s lots more variation there, where parallel constructs can be feeding into transducing/sequencing constructs, feeding into lazy constructs, back into parallel constructs, etc.
@didibus your point still stands about auto-tuning - there could be some *>> thing that monitors timing of the sequence calls in x>> and if they rise above a given threshold (say, 1 ms), relative to the number of cores on a machine, would automatically switch to =>> under the hood. That behavior would be a bit less predictable than either x>> or =>> alone, but it might be a better default for prototyping. PRs welcome!


 I have no idea what the independent and dependent variables are without added context. Interested to see which workloads actually get beyond the 3-4x speedup boundary that I keep encountering.