The visual tools group will have its 21st meeting on Feb 25th.
Agenda
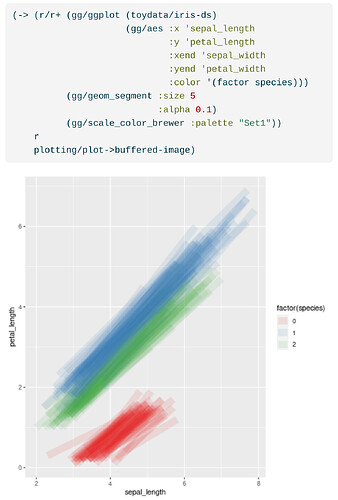
In this meeting, we will learn about ggplot2, a grammar-of-graphics data visualization package of the R language.
- We will explore parts of the ggplot2 book by Hadley Wickham, Danielle Navarro, and Thomas Lin Pedersen.
- If time permits, we will practice using ggplot2 from Clojure through ClojisR.
Suggested background
To prepare for the meeting, it is recommended to:
- have R installed in your environment
- try some code examples from Section 1 of R for Data Science (2e)
- familiarize with R using Sections 2 & 3 of R for Data Science
Joining
Please write to @daslu if you wish to participate. We need to know a bit about your background and expectations to prepare the session well.
You can also use the Add to Calendar to add the event to your calendar.
Length
The official part will be 90 minutes long.
Sometimes, some of us like to stay longer and chat.
Video Call
Zoom link: Launch Meeting - Zoom
Recording
Possibly, we will share a recording of parts of the meeting. This has not been decided yet.
